
Imagine you’ve been working for 10 years, excelling in your career with promotions along the way. Suddenly, you notice changes in systems and processes. New concepts like “dashboards,” or “business analytics,” and terms like “ChatGPT” and “intersectionality” are everywhere. Today’s data revolution holds the promise of better outcomes for citizens. It’s more important than ever for Canadians and decision-makers to understand our country’s social and economic landscape, learning to apply data in their everyday work. Yet, the COVID-19 pandemic tested Statistics Canada’s training program. Due to public health restrictions implemented in early 2020, we had to stop in-classroom training, re-think, and adapt to new realities. But just as every dark cloud has a silver lining, this challenge came with great opportunities.
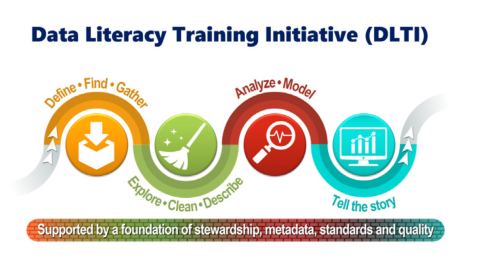
We spent less time teaching and more time listening, as our policy colleagues shared their difficulties in working through an evolving data ecosystem without the right training. In September 2020, we launched the Data Literacy Training Initiative (DLTI) with our first suite of FREE, online, bilingual (that means English and French for us) and accessible training products. We are dedicated to challenging the common notion that becoming more proficient in data is too technical, complicated, or intimidating to be learned in an informal setting. Our learning is framed by the data journey, built on a strong foundation of data stewardship, metadata, standards, and quality. Transitioning from synchronous, in-class teaching to self-guided, online and hybrid learning has been a real adventure, full of successes and challenges. Online learning lacks traditional social stimulation, so it needs to be engaging and fun. To enhance our work, we staffed up and hired a brilliant instructional designer and an imaginative multi-media design student. We’re a small, talented team that enjoys working together, and that makes all the difference.
Starting with short online videos and guides, we responded to the great demand from stakeholders, shifting to developing online courses. Recently, we published a 40-minute course on the six dimensions of data quality and how to evaluate whether data are fit for your analytical purpose. We’ve also collaborated with the UK-based Apoitical.co and will soon launch our new “Data Literacy for the Public Sector” course, an 8 hour foundational course that covers everything from statistical bias to storytelling.
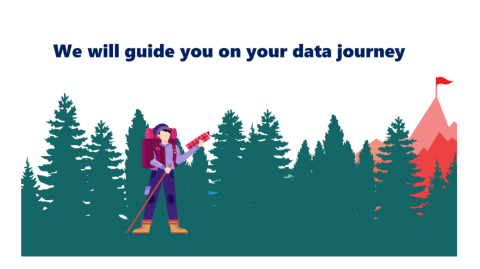
Our team is motivated by the social good and promoting open learning. Many people have shared that, before discovering us, they didn’t know where to start on their data journey. It was too daunting—like an uphill climb through a dense forest. Scary stuff. But our strength as a team is to leverage expertise across Statistics Canada, translate it into plain language and showcase real world applications, making it fun for those who want to learn.
Think of us as a guide for your data journey, whatever your climb looks like, as a data beginner or a data scientist, and everyone in between. We had a great time connecting with like-minded data literacy advocates at the World Statistics Congress this summer. Clearly, we have similar challenges in advancing initiatives and can learn from one another, stronger together in combating misinformation and enabling evidence-based policy.

SOURCE(S):
Statistics Canada - Faces of StatCan